Bus Mapping Tool
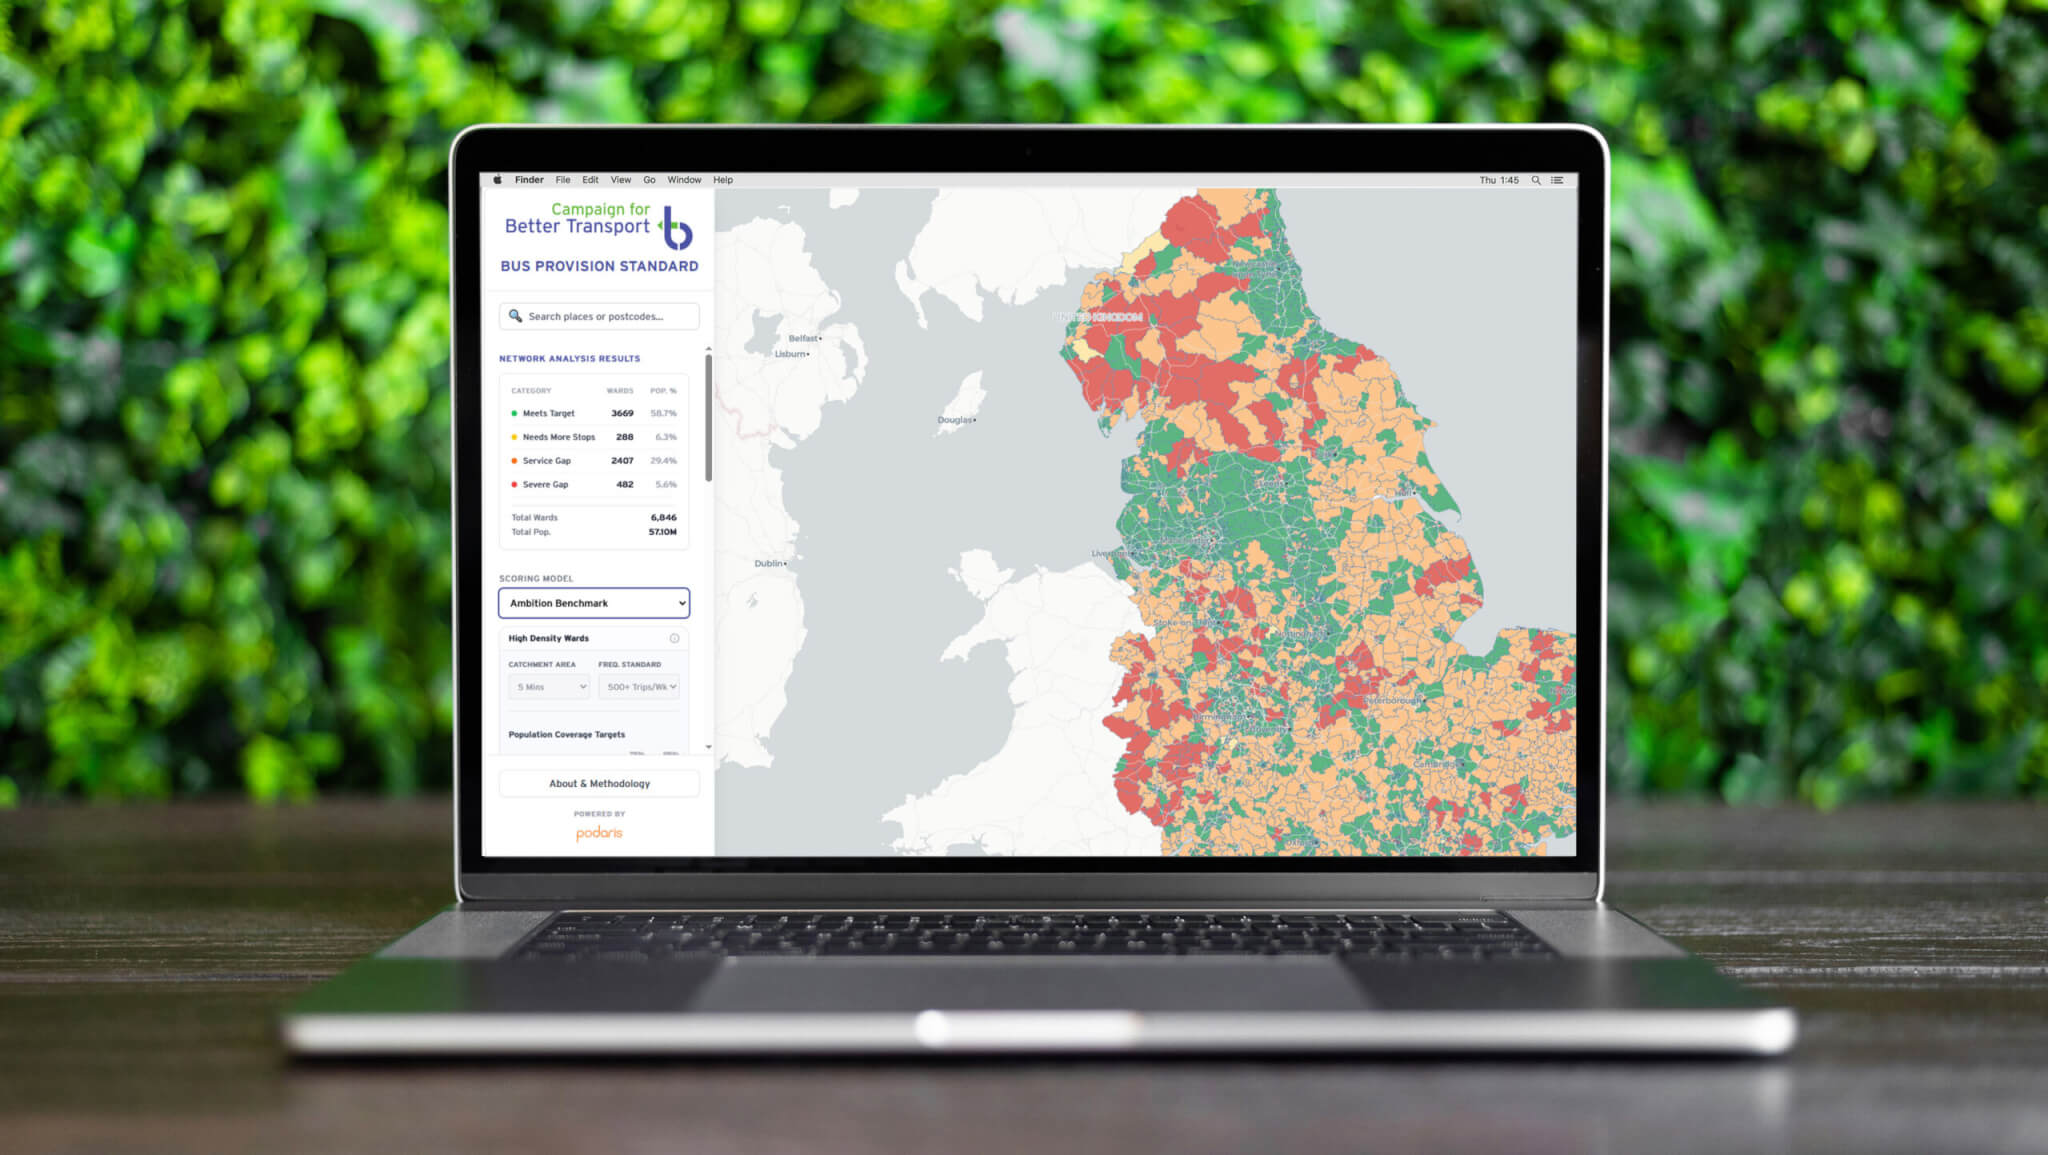
The Bus Mapping Tool, produced in partnership with Podaris, uses a traffic light system to identify which areas in England and Wales lack a decent bus service and where additional investment is needed.
The Bus Mapping Tool shows how many bus services operate a week; what percentage of the people living there can get to a bus stop within a five and ten-minute walk; the bus service frequency; what percentage of residents have access to a car; and how deprived the area is.
Each ward is scored green, yellow, amber or red against two bus service standard benchmarks:
- A minimum baseline (that everyone should have access to)
- An ambition benchmark (that local authorities can strive to get to in future).
Green means there were enough bus stops and services to meet the benchmark; yellow means they require additional bus stops; amber means they require additional services; and red means they failed to meet the minimum number of bus stops and services to meet the benchmark.
The Bus Mapping Tool covers England and Wales and is available for bus service providers to easily see where enhanced services and/or bus stops are needed, and target investment appropriately.
To discuss the tool further, email Silviya Barrett at Campaign for Better Transport: silviya.barrett@bettertransport.org.uk